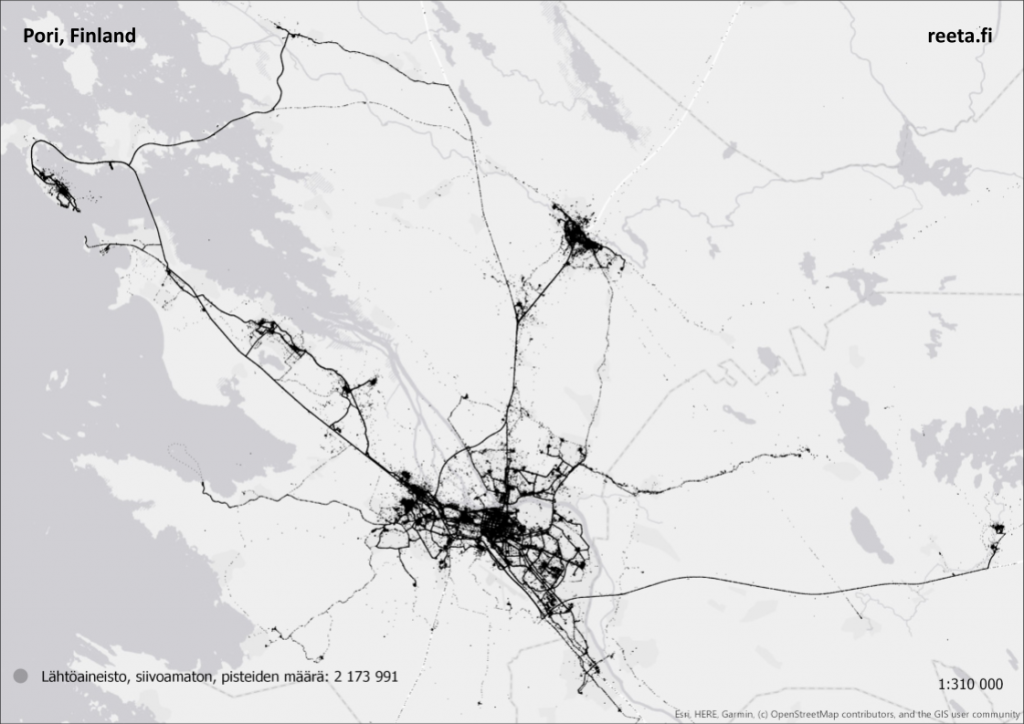
Here is a map from my master thesis – the raw data where everything started – about 2 milloin points from maintance worker locations from 1.5 years. Location Pori, Finland.
Day 2 - Lines
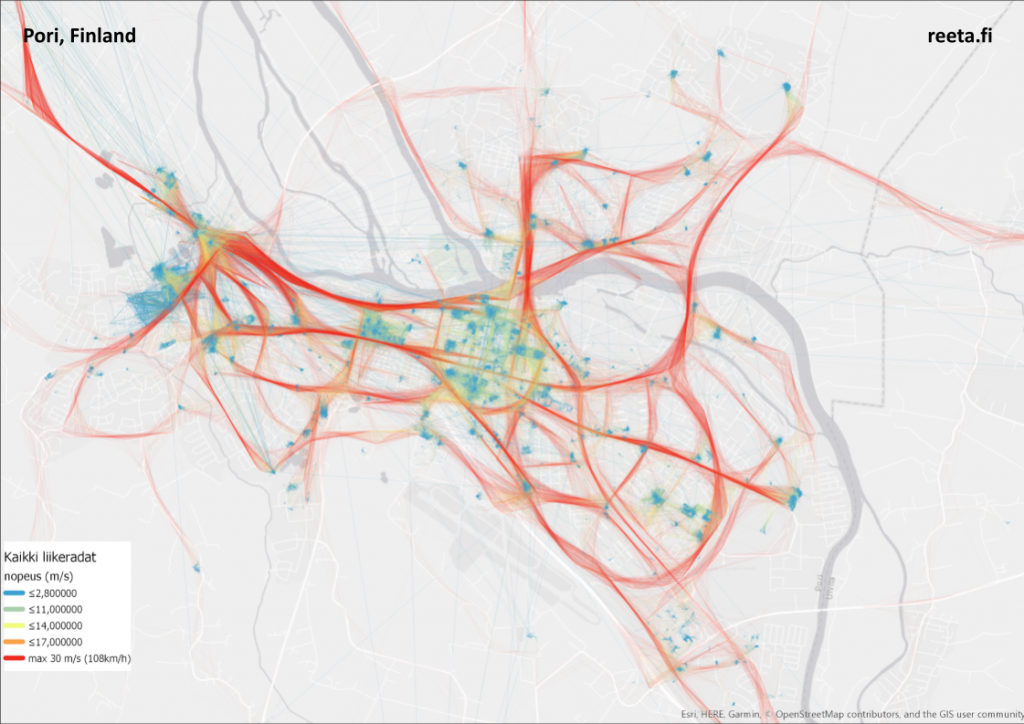
Here is a line map from my master thesis. All 2 milloin points connected together from timestap information.
After connecting the lines, the velocity was calculated to create the visualization.